

Decision models · Alibaba
Qwen3 Reranker 8B
- Task
- Reranking search results
- Returns
- Probability or score
- Precision tier
- 90 / 100
- Size
- 8.2B
- Max input
- 32K tokens
- License
- apache-2.0
- Released
- 2025-06
What it decides
- Returns
- A relevance score (probability of “yes”) for each query and document pair.
- Checks
- Query and document pairs, code
- Languages
- 100+ languages
- Precision
- 90 / 100 · MTEB-R 69.0, MMTEB-R 72.9, MTEB-Code 81.2 (model card).
- Clarity
- Probability or score (15 of 15 clarity points)
- How it runs
- Scores query and document pairs · a small language model, so it runs in the same apps as LLMs.
- License
- apache-2.0 (Open (Apache, MIT))
How to run it
Quantized files · GGUF
Works in llama.cpp (llama-server --rerank), Lemonade and other llama.cpp servers with a rerank endpoint. No sign-in needed.
huggingface.co/mradermacher/Qwen3-Reranker-8B-GGUF (opens in a new tab)
llama-server -hf mradermacher/Qwen3-Reranker-8B-GGUF --rerankOriginal weights · Hugging Face
Full-precision files from Alibaba, for Transformers, Sentence Transformers, Text Embeddings Inference, Infinity or vLLM.
Apps that run Qwen3 Reranker 8B
Our pick for each kind of computer, assuming the model fits in its memory. Pick your own GPU or Mac in the Model Finder for an exact answer.
Mac (Apple silicon)
Windows PC, NVIDIA GPU
Windows PC, AMD Radeon
Linux, NVIDIA GPU
Linux server, 80 GB+ GPUs
| App | Type | Opens it as | Systems | Engine | Start |
|---|---|---|---|---|---|
| llama.cpp | CLI + API | GGUF | macOSWindowsLinux |
|
|
| vLLM | Server | Original weights | WSLWindowsLinux |
|
|
| SGLang | Server | Original weights | WSLWindowsLinux |
|
|
| Lemonade | Desktop app | GGUF | macOSWindowsLinux |
|
|
| Sentence Transformers | Library | Original weights | macOSWindowsLinux | Get Sentence Transformers |
Memory and speed
Each quantization on an NVIDIA GeForce RTX 4090, for one decision on a 512-token input. The best hardware table below covers other GPUs and Macs.
| Format | Memory needed | Time per decision | Decisions per second | Quality | Download |
|---|---|---|---|---|---|
Q4_K_M | 5.9 GB | 81 ms | 12/s | 85Excellent quality (S) · 85 of 100: how capable the model is at Q4_K_M, whatever it runs on. Match score 93/100 (quality, fit, speed and memory use) sets the ranking. | GGUF (opens in a new tab) |
Q5_K_M | 6.7 GB | 83 ms | 12/s | 87Excellent quality (S) · 87 of 100: how capable the model is at Q5_K_M, whatever it runs on. Match score 94/100 (quality, fit, speed and memory use) sets the ranking. | GGUF (opens in a new tab) |
Q6_K | 7.6 GB | 84 ms | 12/s | 89Excellent quality (S) · 89 of 100: how capable the model is at Q6_K, whatever it runs on. Match score 95/100 (quality, fit, speed and memory use) sets the ranking. | GGUF (opens in a new tab) |
Q8_0 | 9.6 GB | 88 ms | 11/s | 90Excellent quality (S) · 90 of 100: how capable the model is at Q8_0, whatever it runs on. Match score 95/100 (quality, fit, speed and memory use) sets the ranking. | GGUF (opens in a new tab) |
F16 | 17.3 GB | 103 ms | 9.7/s | 90Excellent quality (S) · 90 of 100: how capable the model is at F16, whatever it runs on. Match score 95/100 (quality, fit, speed and memory use) sets the ranking. | GGUF (opens in a new tab) Original weights (opens in a new tab) |
Best hardware for Qwen3 Reranker 8B
The least expensive GPU in our catalog that runs it without offloading is the Intel Arc A580 (launch price $179) at Q4_K_M.
| Quality | Hardware | Quant | Memory | Time per decision | Runs |
|---|---|---|---|---|---|
| 90Excellent quality (S) · 90 of 100: how capable the model is at F16, whatever it runs on. Match score 95/100 (quality, fit, speed and memory use) sets the ranking. | 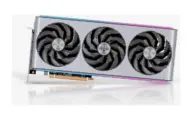 AMD Radeon RX 7900 XTX |
F16 | 18.5 GB / 24.0 GB | 93 ms | Runs great |
| 90Excellent quality (S) · 90 of 100: how capable the model is at Q8_0, whatever it runs on. Match score 95/100 (quality, fit, speed and memory use) sets the ranking. | 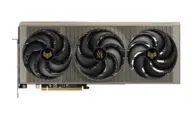 AMD Radeon RX 9070 XT |
Q8_0 | 10.4 GB / 16.0 GB | 97 ms | Runs great |
| 90Excellent quality (S) · 90 of 100: how capable the model is at Q8_0, whatever it runs on. Match score 95/100 (quality, fit, speed and memory use) sets the ranking. | 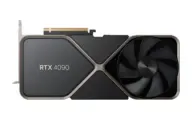 NVIDIA GeForce RTX 4090 |
Q8_0 | 10.8 GB / 24.0 GB | 88 ms | Runs great |
| 90Excellent quality (S) · 90 of 100: how capable the model is at F16, whatever it runs on. Match score 95/100 (quality, fit, speed and memory use) sets the ranking. | 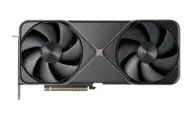 NVIDIA GeForce RTX 5090 |
F16 | 18.9 GB / 32.0 GB | 75 ms | Runs great |
| 90Excellent quality (S) · 90 of 100: how capable the model is at F16, whatever it runs on. Match score 95/100 (quality, fit, speed and memory use) sets the ranking. |  NVIDIA RTX PRO 6000 Blackwell |
F16 | 22.1 GB / 96.0 GB | 66 ms | Runs great |
| 90Excellent quality (S) · 90 of 100: how capable the model is at Q8_0, whatever it runs on. Match score 94/100 (quality, fit, speed and memory use) sets the ranking. |  NVIDIA GeForce RTX 5080 |
Q8_0 | 10.4 GB / 16.0 GB | 121 ms | Runs great |
| 90Excellent quality (S) · 90 of 100: how capable the model is at Q8_0, whatever it runs on. Match score 93/100 (quality, fit, speed and memory use) sets the ranking. |  NVIDIA GeForce RTX 4080 SUPER |
Q8_0 | 10.4 GB / 16.0 GB | 133 ms | Runs well |
| 90Excellent quality (S) · 90 of 100: how capable the model is at Q8_0, whatever it runs on. Match score 92/100 (quality, fit, speed and memory use) sets the ranking. |  NVIDIA GeForce RTX 5070 Ti |
Q8_0 | 10.4 GB / 16.0 GB | 151 ms | Runs well |
| 90Excellent quality (S) · 90 of 100: how capable the model is at Q8_0, whatever it runs on. Match score 92/100 (quality, fit, speed and memory use) sets the ranking. | 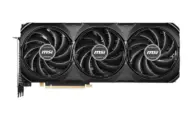 NVIDIA GeForce RTX 4070 Ti SUPER |
Q8_0 | 10.4 GB / 16.0 GB | 156 ms | Runs well |
| 89Excellent quality (S) · 89 of 100: how capable the model is at Q6_K, whatever it runs on. Match score 91/100 (quality, fit, speed and memory use) sets the ranking. |  AMD Ryzen AI Max+ 395 (128 GB) |
Q6_K | 15.3 GB / 96.0 GB | 161 ms | Runs well |
Estimates come from published hardware specs and our open formulas, not from running the model on your machine. Real speed varies with runtime, drivers and settings. Numbers marked “Measured” come from a linked benchmark.