

Playground v2.5 on Intel Xeon Silver (4100 to 4300 series) NAS (32 GB)

Can the Intel Xeon Silver (4100 to 4300 series) NAS (32 GB) run Playground v2.5?
Barely: it runs very slowly
Very slow. At FP16 it needs about 8.9 GB of 26.2 GB usable, with an estimated speed of 6.2 min.
- Best precision
FP16- Memory mode
- Everything on GPU
- Time per image
- 6.2 min
- Output
- 1024×1024, 50 steps
Download Playground v2.5
Original weights · Hugging Face
Full-precision files from Playground AI, for fine-tuning, vLLM, Transformers, Diffusers or ComfyUI.
huggingface.co/playgroundai/playground-v2.5-1024px-aesthetic (opens in a new tab)
How it’s rated
Match score
To order lists, each result also gets a match score out of 100 from four parts. It favors the most capable model that still runs well.
| Model quality | 27.0 / 45 | |
|---|---|---|
| Memory fit | 25.0 / 25 | |
| Speed | 2.5 / 15 | |
| Memory use | 7.9 / 15 | |
| Match score | 62.3 / 100 |
Every precision on the Intel Xeon Silver (4100 to 4300 series) NAS (32 GB)
| Quant | Memory needed | Available | Speed | Memory mode | Runs | Quality | Download |
|---|---|---|---|---|---|---|---|
FP16 | 8.9 GB | 26.2 GB | 6.2 min | Everything on GPU | Very slow | 60Good quality (B) · 60 of 100: how capable the model is at FP16, whatever it runs on. Match score 62/100 (quality, fit, speed and memory use) sets the ranking. | Original weights (opens in a new tab) |
FP8 | 5.6 GB | 26.2 GB | 5.5 min | Everything on GPU | Very slow | 58Good quality (B) · 58 of 100: how capable the model is at FP8, whatever it runs on. Match score 58/100 (quality, fit, speed and memory use) sets the ranking. | Original weights (opens in a new tab) |
Other hardware that runs it
-
60Good quality (B) · 60 of 100: how capable the model is at FP16, whatever it runs on. Match score 79/100 (quality, fit, speed and memory use) sets the ranking.
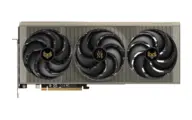 AMD Radeon RX 9070 XT
-
60Good quality (B) · 60 of 100: how capable the model is at FP16, whatever it runs on. Match score 79/100 (quality, fit, speed and memory use) sets the ranking.
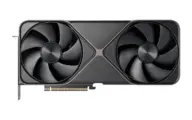 NVIDIA GeForce RTX 5080
-
60Good quality (B) · 60 of 100: how capable the model is at FP16, whatever it runs on. Match score 79/100 (quality, fit, speed and memory use) sets the ranking.
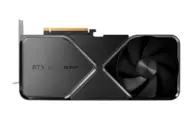 NVIDIA GeForce RTX 4080 SUPER
-
58Good quality (B) · 58 of 100: how capable the model is at FP8, whatever it runs on. Match score 76/100 (quality, fit, speed and memory use) sets the ranking.
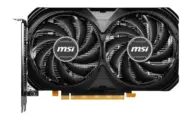 NVIDIA GeForce RTX 4060
-
60Good quality (B) · 60 of 100: how capable the model is at FP16, whatever it runs on. Match score 75/100 (quality, fit, speed and memory use) sets the ranking.
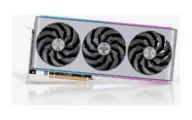 AMD Radeon RX 7900 XTX
-
60Good quality (B) · 60 of 100: how capable the model is at FP16, whatever it runs on. Match score 75/100 (quality, fit, speed and memory use) sets the ranking.
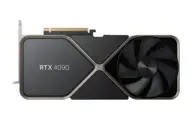 NVIDIA GeForce RTX 4090
Estimates come from published hardware specs and our open formulas, not from running the model on your machine. Real speed varies with runtime, drivers and settings. Numbers marked “Measured” come from a linked benchmark.