

Phi-3.5 Vision Instruct on AMD Radeon RX 7900 XT

Can the AMD Radeon RX 7900 XT run Phi-3.5 Vision Instruct?
Yes, it runs great
Runs great. At F16 it needs about 13.1 GB of 20.0 GB usable, with an estimated speed of 47.8 tok/s.
- Best quant
F16- Generation speed
- 47.8 tok/s
- Prompt processing
- 15,388 tok/s
- First token (1K prompt)
- 0.3 s
- Largest safe context
- 25K
Best app to run it on the AMD Radeon RX 7900 XT
On Windows
- Handy if you already work in Docker.
docker model run hf.co/microsoft/Phi-3.5-vision-instruct
On Linux
- Handy if you already work in Docker.
docker model run hf.co/microsoft/Phi-3.5-vision-instructDownload Phi-3.5 Vision Instruct
Original weights · Hugging Face
Full-precision files from Microsoft, for fine-tuning, vLLM, Transformers.
huggingface.co/microsoft/Phi-3.5-vision-instruct (opens in a new tab)
How it’s rated
Match score
To order lists, each result also gets a match score out of 100 from four parts. It favors the most capable model that still runs well.
| Model quality | 17.1 / 45 | |
|---|---|---|
| Memory fit | 25.0 / 25 | |
| Speed | 15.0 / 15 | |
| Memory use | 15.0 / 15 | |
| Match score | 72.1 / 100 |
Every quantization on the AMD Radeon RX 7900 XT
| Quant | Memory needed | Available | Speed | Runs | Quality | Download |
|---|---|---|---|---|---|---|
Q2_K | 6.5 GB | 20.0 GB | 335 tok/s | Runs great | 26Basic quality (D) · 26 of 100: how capable the model is at Q2_K, whatever it runs on. Match score 59/100 (quality, fit, speed and memory use) sets the ranking. | All files (opens in a new tab) |
Q3_K_M | 6.9 GB | 20.0 GB | 263 tok/s | Runs great | 31Basic quality (D) · 31 of 100: how capable the model is at Q3_K_M, whatever it runs on. Match score 62/100 (quality, fit, speed and memory use) sets the ranking. | All files (opens in a new tab) |
Q4_K_M | 7.4 GB | 20.0 GB | 204 tok/s | Runs great | 36Basic quality (D) · 36 of 100: how capable the model is at Q4_K_M, whatever it runs on. Match score 64/100 (quality, fit, speed and memory use) sets the ranking. | All files (opens in a new tab) |
Q5_K_M | 7.8 GB | 20.0 GB | 168 tok/s | Runs great | 36Basic quality (D) · 36 of 100: how capable the model is at Q5_K_M, whatever it runs on. Match score 65/100 (quality, fit, speed and memory use) sets the ranking. | All files (opens in a new tab) |
Q6_K | 8.2 GB | 20.0 GB | 141 tok/s | Runs great | 37Basic quality (D) · 37 of 100: how capable the model is at Q6_K, whatever it runs on. Match score 66/100 (quality, fit, speed and memory use) sets the ranking. | All files (opens in a new tab) |
Q8_0 | 9.2 GB | 20.0 GB | 104 tok/s | Runs great | 38Basic quality (D) · 38 of 100: how capable the model is at Q8_0, whatever it runs on. Match score 67/100 (quality, fit, speed and memory use) sets the ranking. | All files (opens in a new tab) |
F16 | 13.1 GB | 20.0 GB | 47.8 tok/s | Runs great | 38Basic quality (D) · 38 of 100: how capable the model is at F16, whatever it runs on. Match score 72/100 (quality, fit, speed and memory use) sets the ranking. | Original weights (opens in a new tab) |
Memory figures assume 8K of context. Longer conversations or documents grow the KV cache.
Other hardware that runs it
-
38Basic quality (D) · 38 of 100: how capable the model is at Q8_0, whatever it runs on. Match score 72/100 (quality, fit, speed and memory use) sets the ranking.
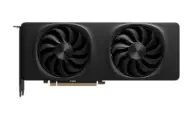 Intel Arc B580
-
38Basic quality (D) · 38 of 100: how capable the model is at Q8_0, whatever it runs on. Match score 72/100 (quality, fit, speed and memory use) sets the ranking.
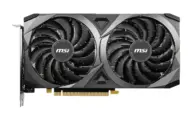 NVIDIA GeForce RTX 3060 12GB
-
38Basic quality (D) · 38 of 100: how capable the model is at Q8_0, whatever it runs on. Match score 72/100 (quality, fit, speed and memory use) sets the ranking.
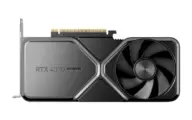 NVIDIA GeForce RTX 4070 SUPER
-
38Basic quality (D) · 38 of 100: how capable the model is at F16, whatever it runs on. Match score 72/100 (quality, fit, speed and memory use) sets the ranking.
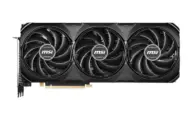 NVIDIA GeForce RTX 4070 Ti SUPER
-
38Basic quality (D) · 38 of 100: how capable the model is at F16, whatever it runs on. Match score 72/100 (quality, fit, speed and memory use) sets the ranking.
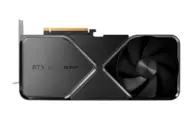 NVIDIA GeForce RTX 4080 SUPER
-
38Basic quality (D) · 38 of 100: how capable the model is at F16, whatever it runs on. Match score 72/100 (quality, fit, speed and memory use) sets the ranking.
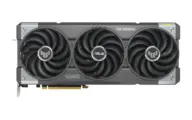 NVIDIA GeForce RTX 5070 Ti
Estimates come from published hardware specs and our open formulas, not from running the model on your machine. Real speed varies with runtime, drivers and settings. Numbers marked “Measured” come from a linked benchmark.